

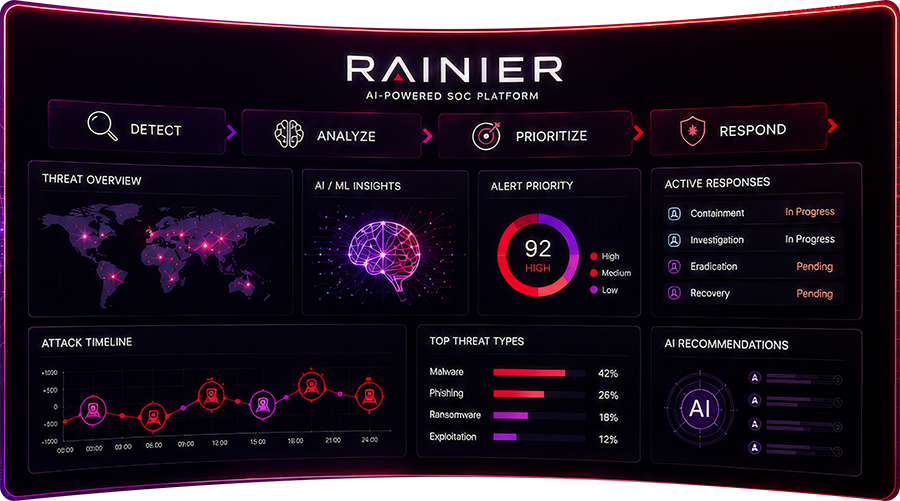
Last week, our team sat down for a live walkthrough of Rainier, the AI-powered SOC platform we’ve built in-house at Network Intelligence, and opened it up for questions from the audience. If you missed it, the full recording is below. This post is a recap for anyone who wants the highlights, plus a few places we’ve pulled in screenshots from the platform itself so you can see what was actually on screen during the demo.
The problem we kept running into
Before we talk about what Rainier does, it’s worth spending a minute on why we built it.
Anyone who’s run a SOC knows the pattern: alerts land in the queue faster than analysts can work through them. Every alert needs the same repetitive steps, pulling context from the SIEM, checking IPs and hashes against threat intel sources, correlating with anything similar that’s already open, writing up what happened, and deciding what to do next. None of that is hard work exactly, but it’s a lot of it, and it’s the kind of work that burns analysts out and slows down response on the alerts that actually matter.
The traditional fix has been SOAR platforms and playbooks. But as our team found while evaluating what was already on the market, playbook-based automation has its own ceiling. Every new use case means writing another playbook. Every new integration means custom scripting. A SOC running 20 use cases today might need to cover 200 or 500 as coverage matures, and at that scale, one broken workflow step can cascade into failures across the rest.
That gap, between what detection tools surface and what a human actually has time to do about it, was the starting point for Rainier.
What Rainier actually is
Rainier is built as a fully agentic platform rather than a playbook-driven one. Instead of writing a workflow for every use case, the platform runs a set of specialized AI agents, around 18 of them in the current build, each handling a specific role in the investigation pipeline: pulling alerts from the SIEM, enriching indicators against threat intel sources, correlating and deduplicating related alerts, drafting case summaries, notifying clients, and reading client responses to decide next steps.
The pipeline covers the full lifecycle end to end: Detect → Triage → Correlate → Investigate → Decide → Contain → Close.
A few design choices came up repeatedly during the demo that are worth calling out:
- No playbooks to build or maintain. Adding a new alert source is a configuration step, not a new round of Python scripting.
- A self-hosted, locally developed LLM. Customer data and telemetry don’t leave the platform. Where external lookups are genuinely needed (a VirusTotal or AbuseIPDB check, for instance), those go out through API calls, not through the LLM itself.
- SIEM and EDR agnostic. The live demo ran on QRadar, but the team was clear that Rainier sits as a layer on top of whatever’s already in place, Splunk, Sentinel, Wazuh, any SIEM, EDR, or XDR.
The numbers shared on the call
A few figures came up during the session that are worth repeating, with the caveat that these were shared as the team’s own internal benchmarks from testing and early production use, not third-party-audited figures:
- The platform has been tested at 20,000+ alerts per day of processing capacity
- In the last 30 days of production use, it processed roughly 40,000 alerts
- Across the broader testing and detection period, cumulative volume passed 100,000 alerts processed
- One example given live during the demo: a specific alert was detected and pushed to the customer in 41 seconds
- On the effort side, the team broke down where the reduction comes from: roughly 80% reduction in triage and false-positive suppression effort, about 90% of IOC and entity enrichment handled inline automatically, and around 85% of correlation and deduplication handled without analyst involvement, netting out to a headline claim of roughly 80% less L1 effort overall
Worth noting: the platform doesn’t just process faster, it changes what’s left for a human to do. On a responsive case, the team described closing an alert within about 10 minutes end to end, most of which is waiting on the client’s own reply, not analyst work.
Inside the platform: what the demo actually showed
This is the part best watched rather than read, but here’s what was walked through live, in the order it came up.
The dashboard and customer portal
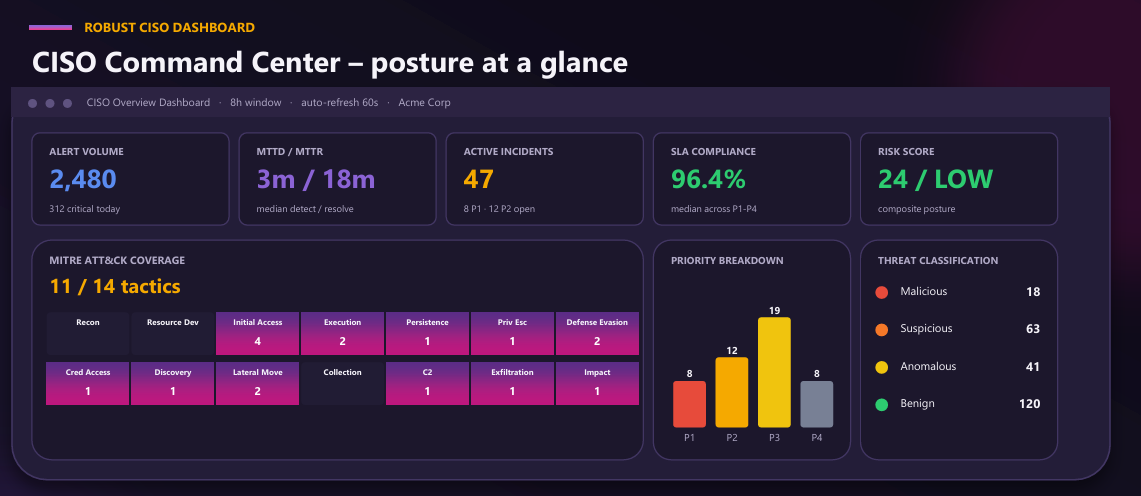
The default landing view after login shows the operational picture at a glance: total alerts, active incidents, risk posture, compliance percentage, and mean-time-to-detect. Since Rainier is built to support MSSP-style multi-tenant use, there’s a client switcher to move between customer environments from the same console. A separate customer-facing portal gives clients their own view of the same KPIs, open cases, and average response times, without exposing the full analyst console.
Case management
Every alert becomes a searchable, filterable case: client name, case ID, use case, current pipeline stage (detect, triage, investigate, respond, close), priority, threat classification, and case age. One case shown live had a 41-second mean-time-to-detect and was sitting in “response pending,” waiting on the client to confirm whether the activity was genuine.
The case view (“war room”)
Opening an individual case shows an AI-generated executive summary of what happened, the raw log data behind it, and a response panel where an analyst (or the system itself, based on client instruction) can isolate an endpoint, block a hash, or take other containment actions directly from the case, no separate console required.
An Intelligence tab on each case shows the extracted entities (IPs, email addresses, endpoint names), the MITRE ATT&CK technique the behavior maps to, and threat intel enrichment pulled from sources like VirusTotal, AbuseIPDB, and OTX.
Client-response handling
This was one of the more detailed parts of the demo. When a case is opened, Rainier notifies the client by email. When the client replies in plain language, the LLM reads the response, classifies the intent, and acts on it, closing the case, keeping it open for further investigation, or escalating, without an analyst having to read the email chain themselves.
A few details the team was specific about:
- Replies are checked against DMARC and sender authorization before being acted on, so a spoofed or unauthorized reply can’t close a case
- If a client doesn’t respond, the platform sends configurable reminders and can auto-close based on an SLA deadline if the client has agreed to that policy
- If a reply comes in with a suspicious attachment, the attachment is quarantined and not processed, only the text response is read
Reducing noise over time
One recurring theme: Rainier is built to get quieter, not louder, as it runs. A “Flagged Similar” feature detects when a new alert shares entities and characteristics with a case that’s already open, and groups it instead of creating a duplicate. The team also described a persistent-rule mechanism that learns from repeat false positives, so a noisy use case that’s already been confirmed as benign doesn’t keep flooding the queue.
Compliance and data handling
Given how much of the conversation touched on AI and data handling, this came up directly in the Q&A: the platform is built to support ISO 27001, SOC 2 Type II, NIST, PCI DSS, HIPAA, India’s DPDP Act, and GDPR, reflecting the fact that the team supports customers across the US, META, APAC, and India. Configuration changes are tracked through an audit trail, and access is role-based, administrators, analysts, and clients each see a different, scoped view of the same platform.
So what happens to the analyst?
This question came up more than once, understandably. The answer the team gave was consistent: the repetitive part of the job, copying data into templates, manually checking IOCs, writing the same case notes, is what goes away. What’s left, and what becomes more central, is judgment: deciding whether something historically normal is actually abnormal in context, deep investigation when a client asks for it, and increasingly, oversight of the AI systems themselves as more of the SOC becomes agentic.
As one of the presenters put it, the initial triage doesn’t need a human in the loop, but the judgment call on a genuine deep investigation still does.
Q&A highlights
A few audience questions stood out:
“We use Splunk for cloud monitoring. Can Rainier replace that, or does it sit alongside it?” Rainier isn’t built around any single SIEM. It sits on top of whatever’s already in place, Splunk, QRadar, Sentinel, Wazuh, or any SIEM/EDR/XDR, and adds the investigation, enrichment, and response layer on top.
“What AI tools and capabilities are actually behind this?” The team confirmed the platform runs on locally hosted, in-house-tuned LLMs (Llama and Mistral were both mentioned), specifically to keep client data from leaving the platform. Each of the 18 agents handles a distinct role in the pipeline rather than one general-purpose model trying to do everything.
“Does the AI keep learning from incidents and reduce noise over time?” Yes, via the persistent-rule and Flagged Similar mechanisms described above; the platform is designed to correlate against what’s happened historically rather than treating every alert as new.
What’s next
This session was framed as the first of a few planned deep-dives, with more detail promised on the detection engineering side and additional platform capabilities in upcoming sessions. If you want to be notified when those go live, keep an eye on our webinar page or reach out directly.
Want to see Rainier running against your own environment? Book a walkthrough and we’ll show you what it catches.